Trace viewer
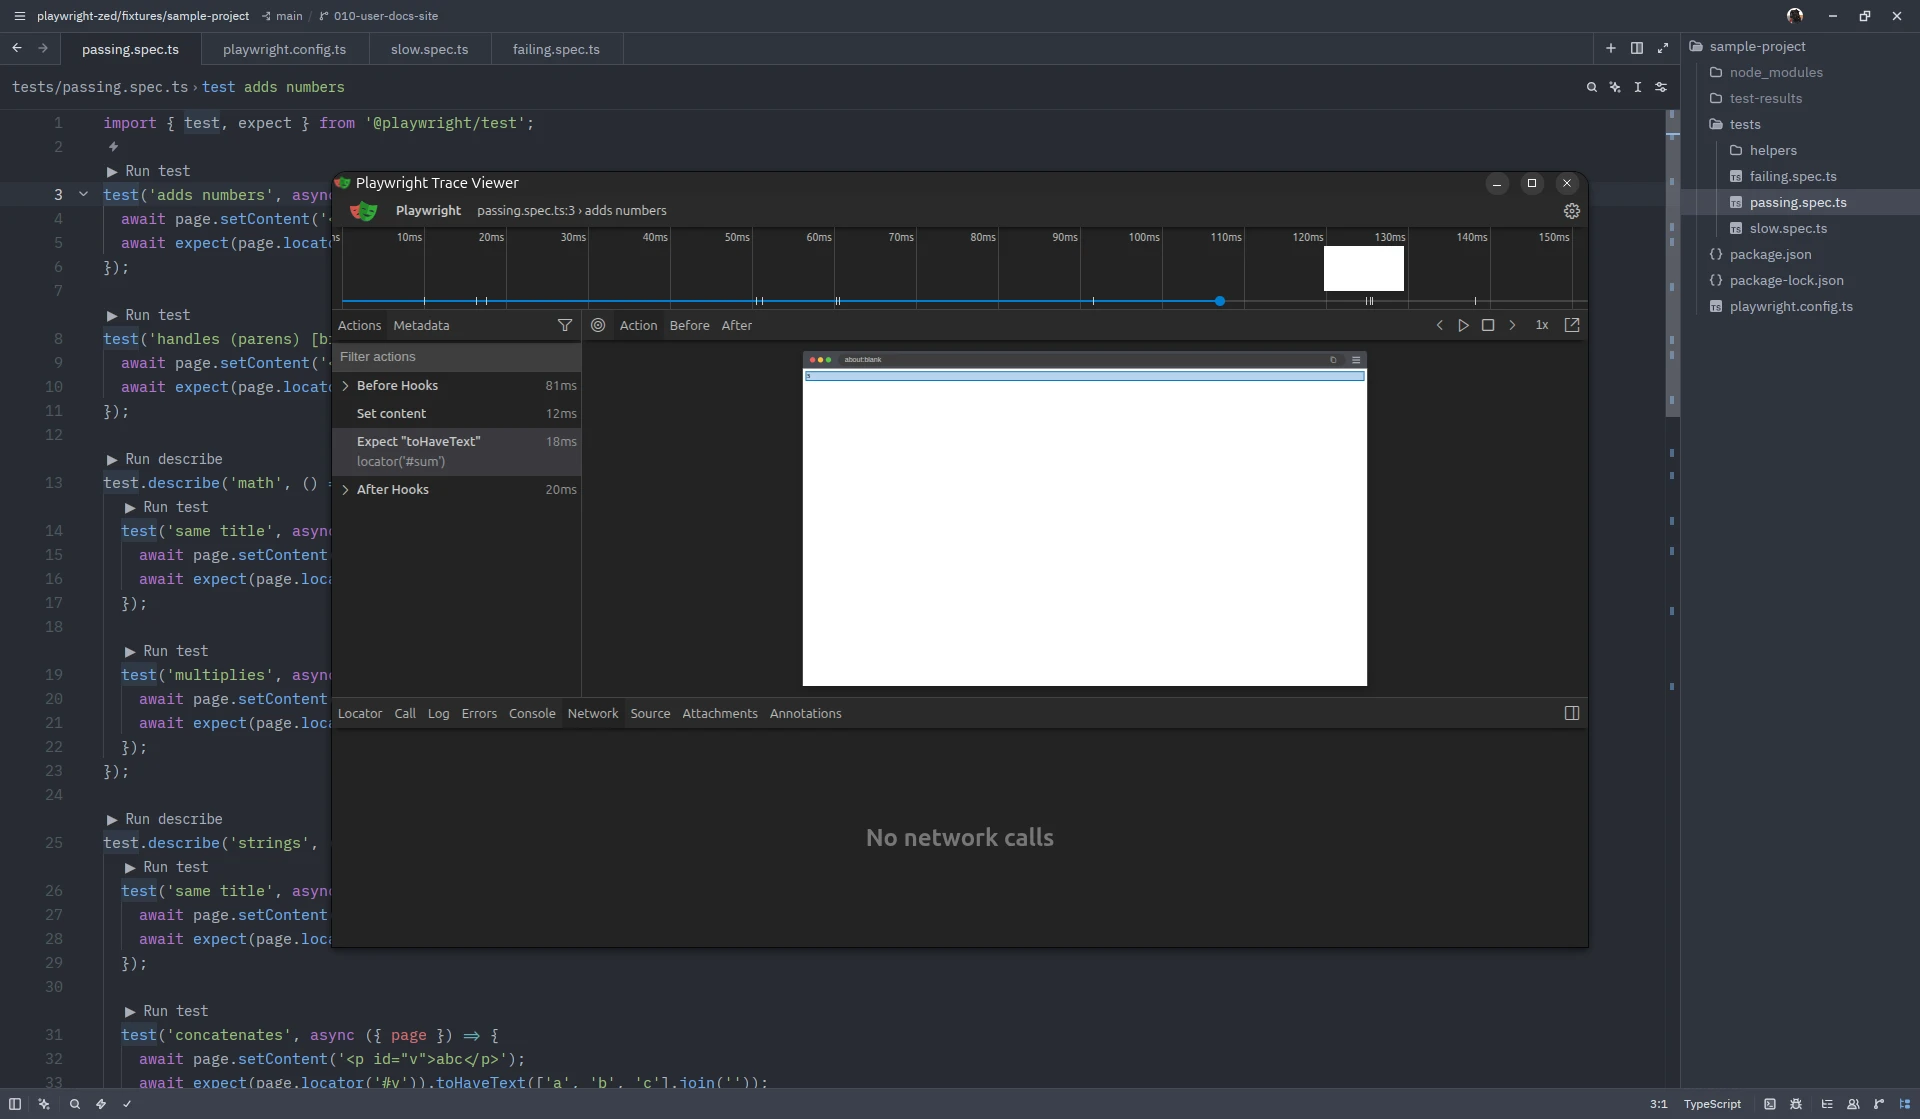
Like the VS Code extension’s Show trace viewer checkbox, Playwright: [ ] Show trace
viewer (in the ctrl-. menu of any file that belongs to a Playwright configuration)
makes every run record a full trace and opens
Playwright’s own trace viewer window for it.
How it behaves
Section titled “How it behaves”- Run a single test (▶ Run test or Run test at cursor) and the viewer opens with that test, following it while it runs and showing the final trace when it ends. Later single-test runs reuse the same window. If you close the window, the next trace opens a new one.
- After Run file, Run describe or Re-run last, put the cursor inside a test and choose Playwright: Show trace to see that test’s trace from the last run. A test that recorded none (skipped, or not part of the run) gets a message instead.
- Choose Playwright: [x] Show trace viewer again to turn it off: the window closes and
runs go back to your configuration’s own
tracesetting. Every toggle is confirmed by a notification, for the same menu-caching reason as the project picker.
What it costs
Section titled “What it costs”While it is on, runs pass --trace on to Playwright, so they take a little longer and
test-results/ holds a trace.zip per test; Playwright manages those files, the
extension never deletes them. The viewer is started from your project’s own Playwright
(playwright show-trace), so it needs the Chromium that npx playwright install
provides; if it cannot start, you get one error notification with the command, and the
run itself is unaffected.
Remembered and defaults
Section titled “Remembered and defaults”The choice is remembered per user in trace-viewer.json under the
state directory. A folder or team default is
the showTrace key of the settings block and
applies until you toggle the option yourself. Turning the trace viewer on turns
Show browser off, and the other way round.
Screenshots on this site show Zed 1.26.2 on Linux with Playwright Runner 0.8.0; the window chrome differs per platform.